When you depend on a platform for your production applications, you need to know it's working. Not just trust - actual visibility into system health and performance.
In October 2025, we launched the RESTHeart Cloud Status Page, giving you real-time visibility into our infrastructure health.
Why a Status Page?
Transparency builds trust. When issues occur (and they occasionally do with any system), you shouldn't have to wonder whether the platform is down or if it's your code. You need to know which regions are affected, whether the database is responding, and what the current performance looks like. The status page answers these questions instantly.
What You Can See
Real-Time System Status
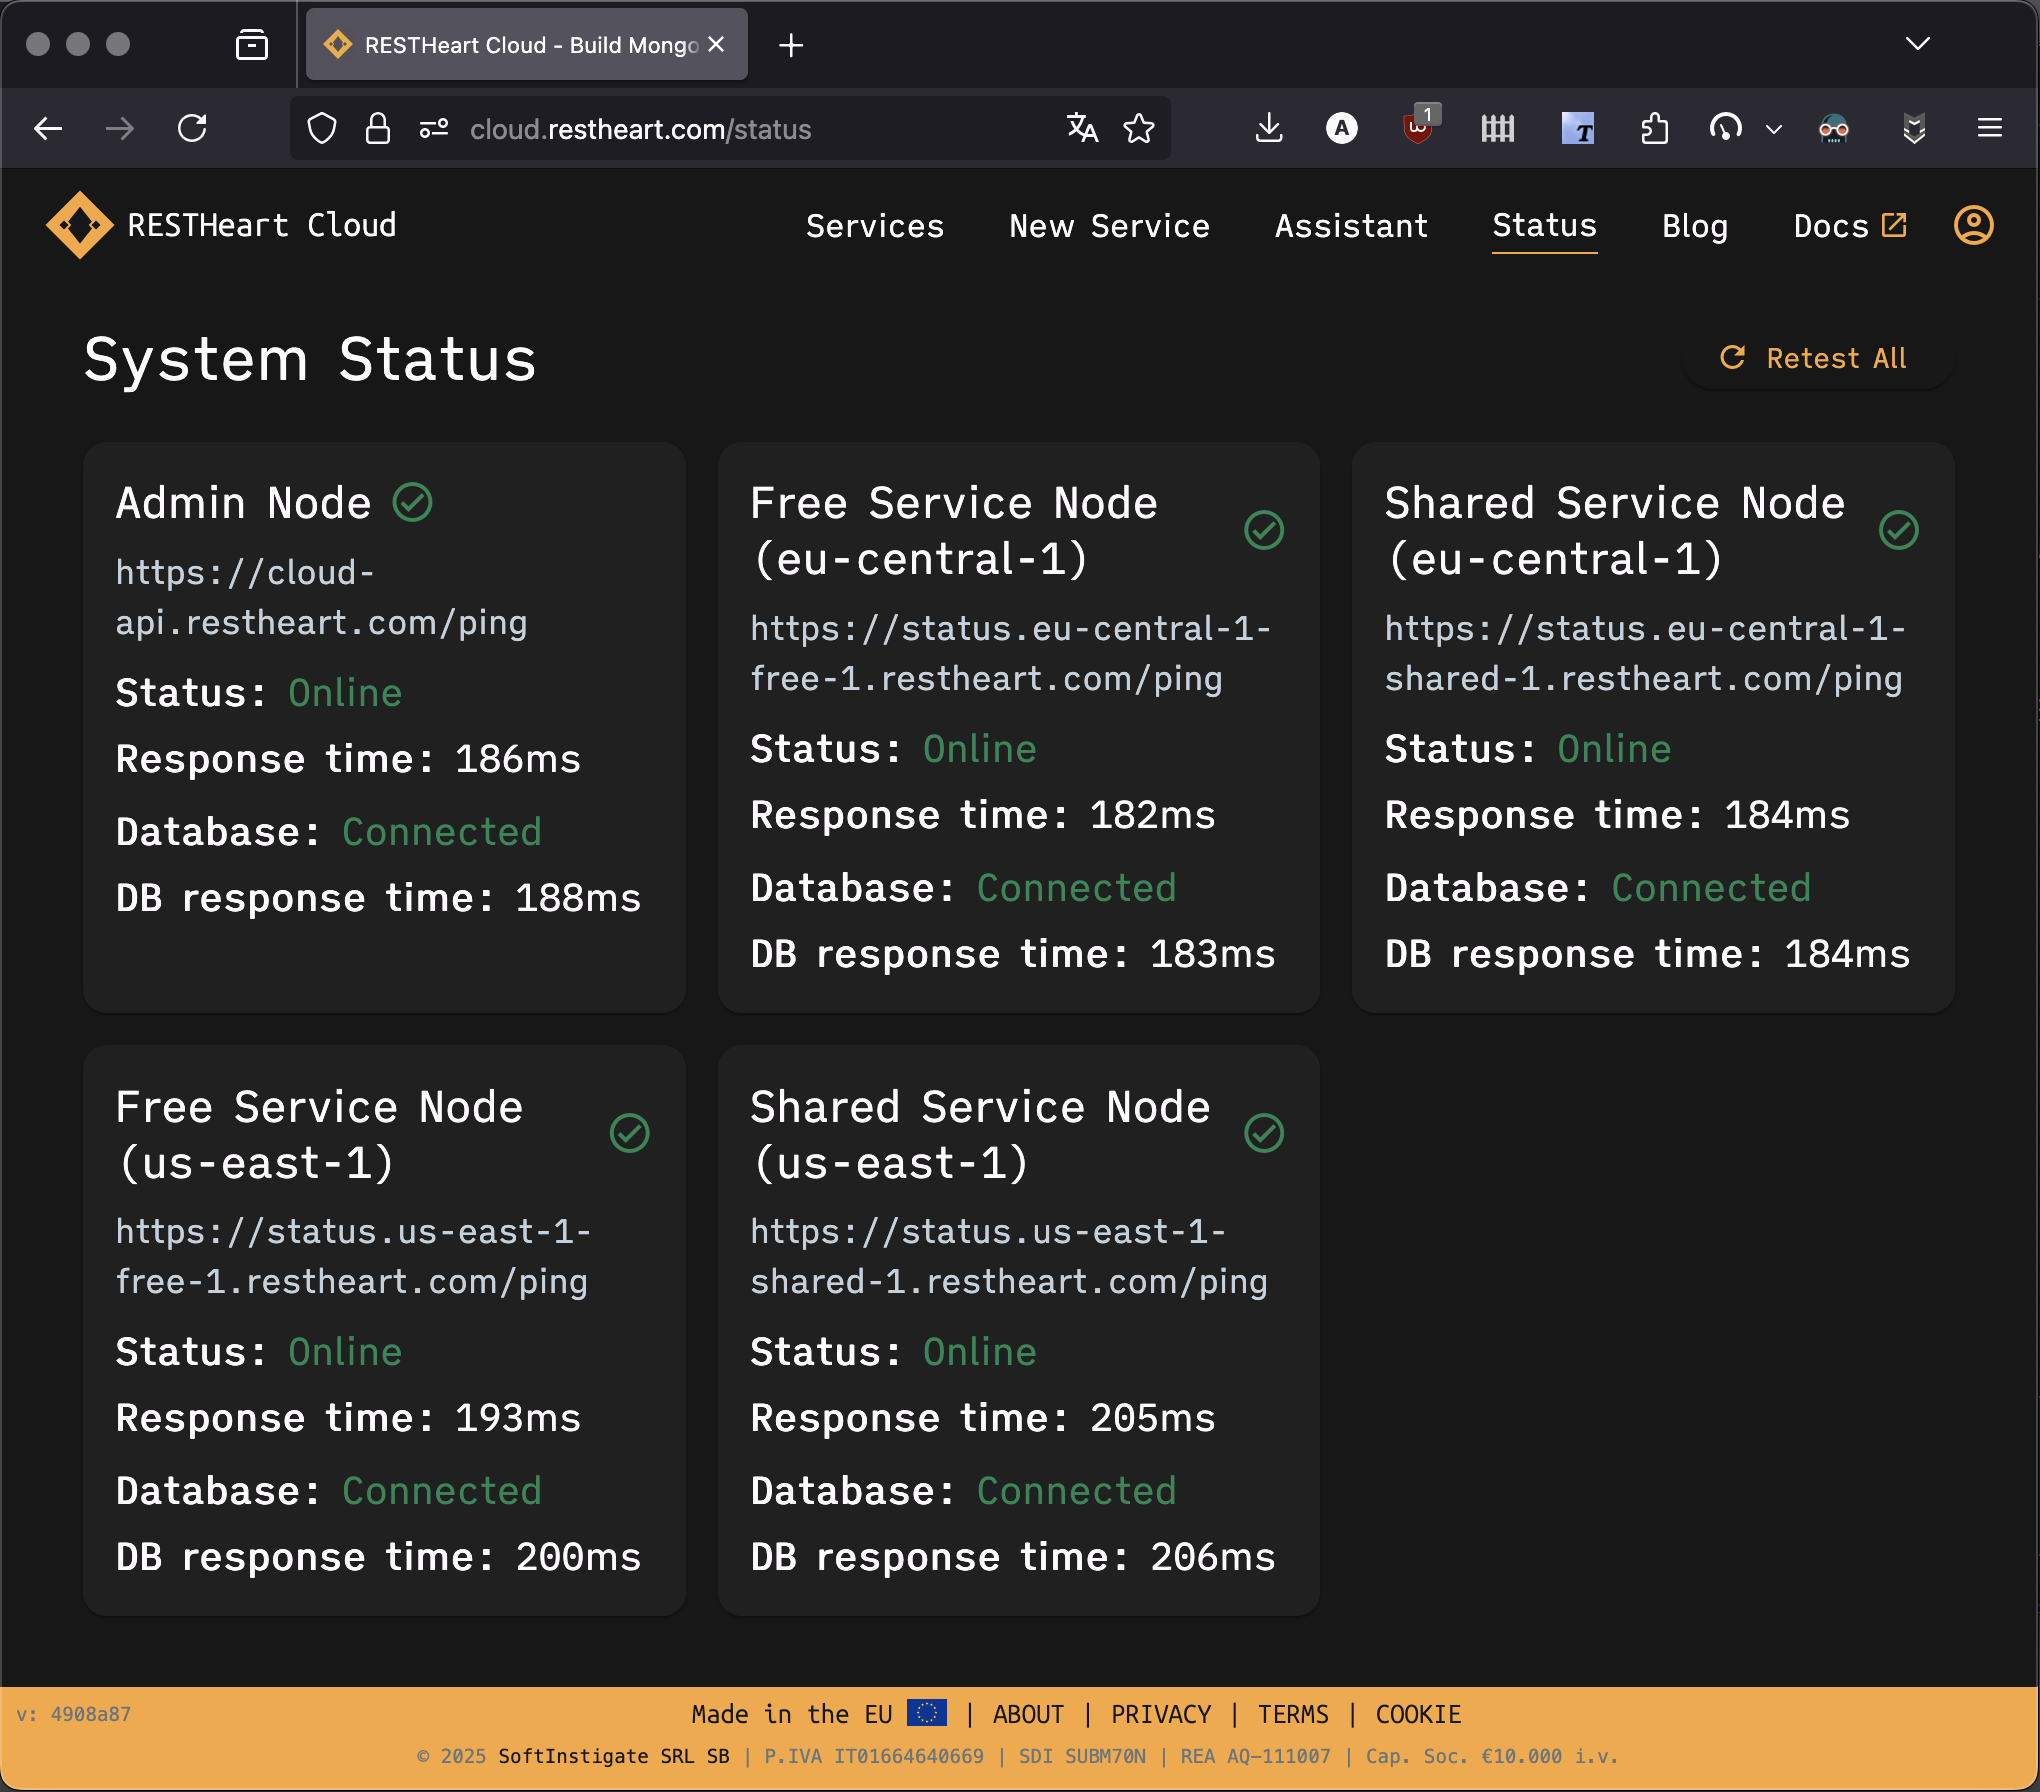
The status page shows the health of all RESTHeart Cloud nodes across our infrastructure.
In EU Central 1, located in Frankfurt, you can see API node status, database connectivity, and response times. In US East 1, located in Virginia, the same information is available: API node status, database connectivity, and response times.
Each node displays comprehensive health information. Online or offline status tells you whether the service is responding. Response time shows you how fast the API is performing. Database status confirms whether MongoDB is connected. Database response time indicates how fast database queries are executing.
Performance Metrics
Beyond just "up or down," you see actual performance characteristics. API response times are shown in milliseconds, giving you precise measurements. Database query latency is tracked separately. Real-time testing results provide current data rather than stale snapshots.
This helps you understand not just availability, but performance characteristics that affect your users' experience.
Live Testing
The status page actively tests all nodes continuously. Click "Retest All" to run fresh health checks whenever you want current information. API ping tests verify responsiveness. Database connectivity checks ensure the data layer is healthy. Performance measurements give you quantitative data.
Results update in real-time, giving you current information rather than cached status.
Access the Status Page
The status page is public and available to everyone at https://cloud.restheart.com/status. No login required. Bookmark it, share it with your team, monitor it during deployments - it's there when you need it.
What We Monitor
API Health
Each RESTHeart Cloud node is continuously monitored for health. Health endpoint responses are checked constantly. Response time tracking identifies performance degradation. Error rates are monitored to catch issues early.
Database Connectivity
MongoDB connectivity for each node is verified continuously. Connection status confirms the database is reachable. Query response times track database performance. Database health metrics provide deeper insights into storage system status.
Regional Status
Separate monitoring for each region provides granular visibility. EU Central 1 infrastructure is monitored independently. US East 1 infrastructure has its own health checks. Independent health tracking for each location means you know exactly where issues are if they occur.
Using the Status Page
During Development
When testing your application, check the status page during debugging. If you're seeing errors, verify whether the platform is healthy, whether response times are normal, and whether your region is affected. This quickly distinguishes platform issues from application bugs, saving debugging time.
In Production
Watch the status page during your deployments to ensure you're not deploying during platform issues. Verify platform health before and after releasing changes to confirm your deployment succeeded in a healthy environment.
When troubleshooting user reports, check the status page first. If the platform is healthy, investigate your application. If there are platform issues, wait for resolution or check incident updates before spending time debugging your code.
Team Communication
Link to the status page in team chats when discussing issues so everyone sees the same real-time data. This shared context prevents miscommunication and duplicate investigation work.
If clients ask about service health, share the status page. Transparent, real-time information builds confidence and demonstrates your commitment to operational visibility.
What Status Means
Online (Green)
Green status means everything is working normally. The API is responding as expected. The database is connected and performing well. Response times are healthy within normal ranges. All systems are operational and serving traffic.
Offline (Red)
Red status indicates issues that need attention. The API may not be responding, database connection may have issues, or the service may be temporarily unavailable.
When you see red, we're already working on it. Our monitoring alerts us immediately when problems occur. Typically issues resolve quickly because our operations team is notified instantly.
Transparency is a Commitment
The status page represents our commitment to transparency with our users.
We don't hide issues. When problems occur, you see them immediately. We don't hide behind vague "investigating" messages without real data.
Real-time data means status reflects actual system health, tested continuously. Information is not cached or delayed - you see what's happening right now.
Regional visibility shows exactly which regions are affected. If EU has issues but US is fine, you know immediately and can plan accordingly.
Future Enhancements
The status page is our first step toward complete operational transparency. We're planning several enhancements.
Historical uptime tracking will let you see uptime percentages over time and reliability trends across days and weeks. Incident history will document past incidents and their resolutions, helping you learn from history and understand patterns. Scheduled maintenance notices will provide advance warning of planned maintenance windows so you can plan around them. Status notifications will let you subscribe to alerts for status changes via email or webhooks, ensuring you're informed immediately. Performance trends will show charts of response time trends over hours and days, helping you understand normal patterns and spot anomalies.
Want something specific on the status page? Let us know at support@restheart.com - we hear you and prioritize features based on user feedback!
More Than Uptime
The status page isn't just about proving reliability. It's about giving you the information you need to build and run great applications with confidence.
When your app behaves unexpectedly, check the status page to rule out infrastructure issues. When planning a major deployment, watch the status page to ensure platform stability. When a client asks about infrastructure health, share the status page to demonstrate transparency.
It's a tool for developers, by developers. We built the transparency we'd want to see in platforms we depend on.
The 10-Year Commitment
RESTHeart has been reliable for over 10 years. The status page makes that reliability visible and verifiable rather than just claimed.
We've been powering production applications since 2015. We don't take uptime lightly - our reputation depends on it. The status page is our way of showing, not just telling, that we're dependable. It's accountability through transparency.
Check It Out
Visit the status page now at https://cloud.restheart.com/status to see real-time health of RESTHeart Cloud infrastructure.
Bookmark it for quick access during debugging. Share it with your team for operational awareness. Use it whenever you need to know the real-time health of RESTHeart Cloud infrastructure.
Questions?
Have questions about the status page or what you're seeing?
Contact us: support@restheart.com
We're here to help you understand our infrastructure and build with confidence.
RESTHeart Cloud: Transparent, reliable, trustworthy. Check our status anytime.
Ready to Build Something Great?
Focus on what makes your app unique. Your backend is ready in minutes. Start with our free tier - no credit card required.